pXRF &
Geochemistry
On-site Quantitative Analysis · Core Sampling · Soil Composition
X-Ray
Fluorescence
Portable X-ray fluorescence (pXRF) analysis directs X-rays at a sample, causing its atoms to emit fluorescent X-rays unique to each element. This fluorescent signature is a fingerprint that reveals the precise material composition of the sample — instantly, on-site.
Values are calibrated to a known standard, and pXRF drift is accounted for by taking readings of local soil before and after testing samples — ensuring reliable, quantitative results without laboratory delays.
All elements heavier than sodium are quantified in percentage weight — no laboratory required.
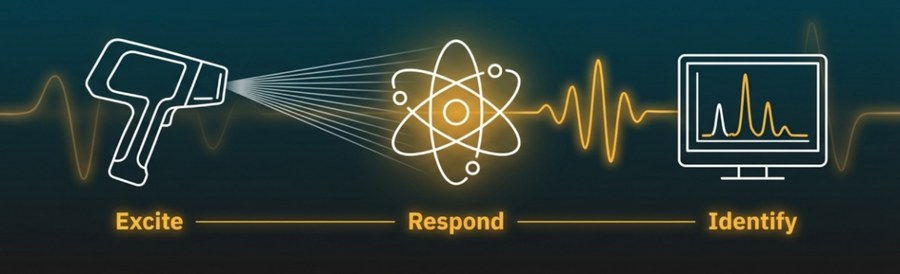
pXRF operation: X-rays excite the sample atoms → characteristic fluorescent X-rays emitted → elements identified and quantified
Quantitative
Core Geochemistry
Core samples are analysed utilising pXRF directly in the field, delivering quantitative geochemical profiles along the full core length — without waiting for laboratory results that delay decision-making.
pXRF data is calibrated to the local geology (e.g. Tasmania Basalt) and drift-corrected with readings of local soil before and after each testing session, ensuring data integrity across the full survey run.
| Category | Elements | Typical Use |
|---|---|---|
| Major Oxides | Si, Al, Fe, Ca, Mg, K, Ti | Lithology classification |
| Heavy Metals | Pb, Zn, Cu, As, Cr, Ni | Contamination assessment |
| Rare Earths | La, Ce, Nd, Y, Zr | Mineral exploration |
| Pathfinders | Sb, Mo, Ba, Sr, Rb | Ore body vectors |
- —Readings calibrated to Tasmania Basalt standard for regional accuracy
- —Drift corrected with local soil blanks before and after each session
- —Data exported directly to CSV / GIS formats for immediate use
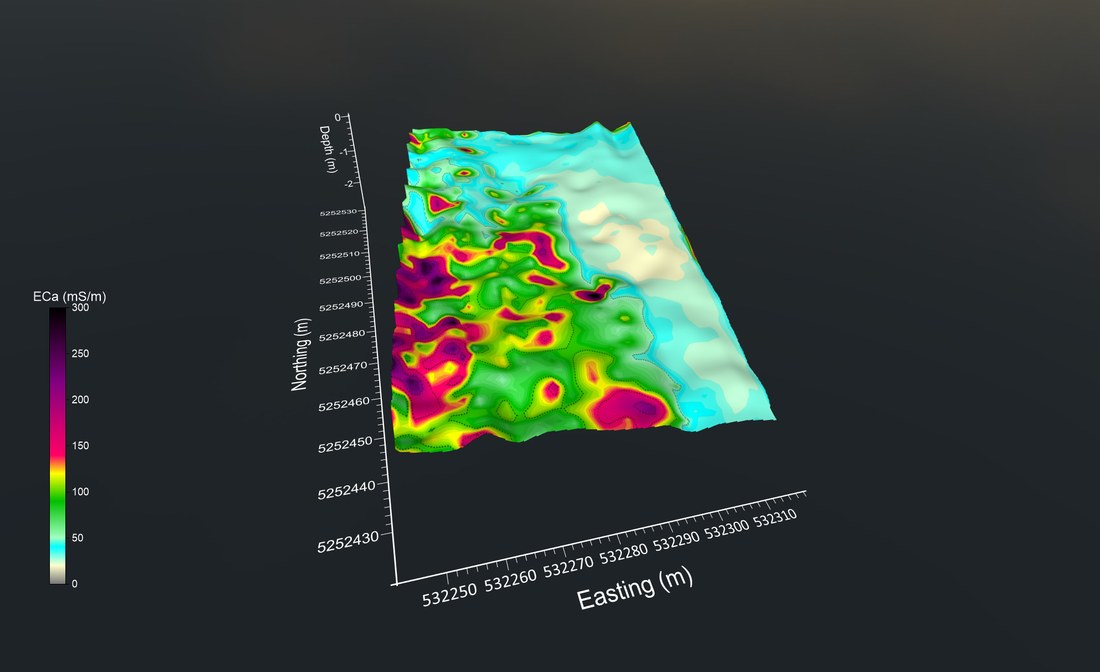
3D element concentration surface — spatial distribution of geochemical values derived from pXRF core data integrated with positional GIS
Geochemical Maps
& 3D Modelling
When pXRF data is combined with spatial coordinates, it can be gridded and visualised as 3D geochemical concentration surfaces — revealing spatial trends, anomaly corridors and depth zonation that raw tables cannot convey.
Integration with EM and resistivity surveys provides a combined geophysical and geochemical picture — correlating conductivity anomalies with element concentrations to build a complete site model.
- Heavy metal contamination
- Mine tailings characterisation
- Acid rock drainage assessment
- Landfill leachate geochemistry
- Ore body vectoring
- Lithological discrimination
- Alteration zone mapping
- Soil geochemical surveys
Element Variation
with Depth
pXRF analysis at regular depth intervals along cores produces continuous element profiles — revealing stratigraphic changes, alteration boundaries and mineralisation zones that spot sampling misses.
Multiple cores across a site enable cross-section and fence diagram construction, tying surface geochemistry to depth and defining three-dimensional ore and contamination geometries.
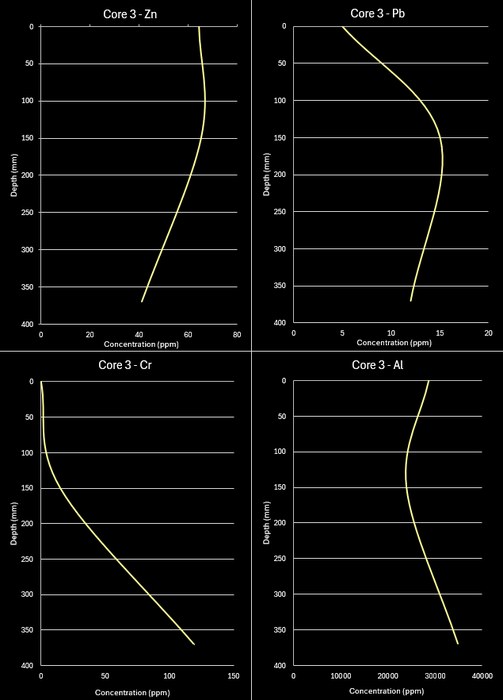
Multi-core depth profiles — element concentration plotted against depth (m) with contamination boundaries identifiable from geochemical breaks